
| Researcher: Nate Sparrow Observations suggest that NSVS 5196635 is an eclipsing variable star of W Ursae Majoris type. This star is located at α=15:57:05.3 δ=+50:05:27.9 and has the following alternate stellar designations: TYC 3496-379-1, Gaia DR1 1403138121654190976, CRTS J155705.4+500527, 2MASS J15570532+5005278, and [GGM2006] 5207106. Star Field with stars used in ensemble differential photometry are shown in Figure 1. |
 Figure 1: Star field with ensemble stars used for differential photometry marked. The eclipsing variable star NSVS 4161544 is marked by the green target (T1). All ensemble stars are marked by the red apertures and designated the labels C2-C5. If a B band magnitude is known, it is given with each comparison along with flux counts. Field scale is given on the left side of the image. Image is a representative image taken with the BSUO 20-inch telescope. Figure 1: Star field with ensemble stars used for differential photometry marked. The eclipsing variable star NSVS 4161544 is marked by the green target (T1). All ensemble stars are marked by the red apertures and designated the labels C2-C5. If a B band magnitude is known, it is given with each comparison along with flux counts. Field scale is given on the left side of the image. Image is a representative image taken with the BSUO 20-inch telescope. |
| We have observed this star with the Ball State University Observatory (BSUO) 20-inch (0.6-m) telescope in the Johnson B (B) & V (V), and Cousins R (Rc) bandpasses. All stellar photometry is performed by the AstroImageJ (AIJ) software package. All photometry is performed with similar ensemble stars. If a calibrated magnitude for a comparison star is known, then it is used by AIJ to calibrate the magnitude for the target star. Folded light curves are shown for V, (B-V), and (V-Rc) in Figure 2. |
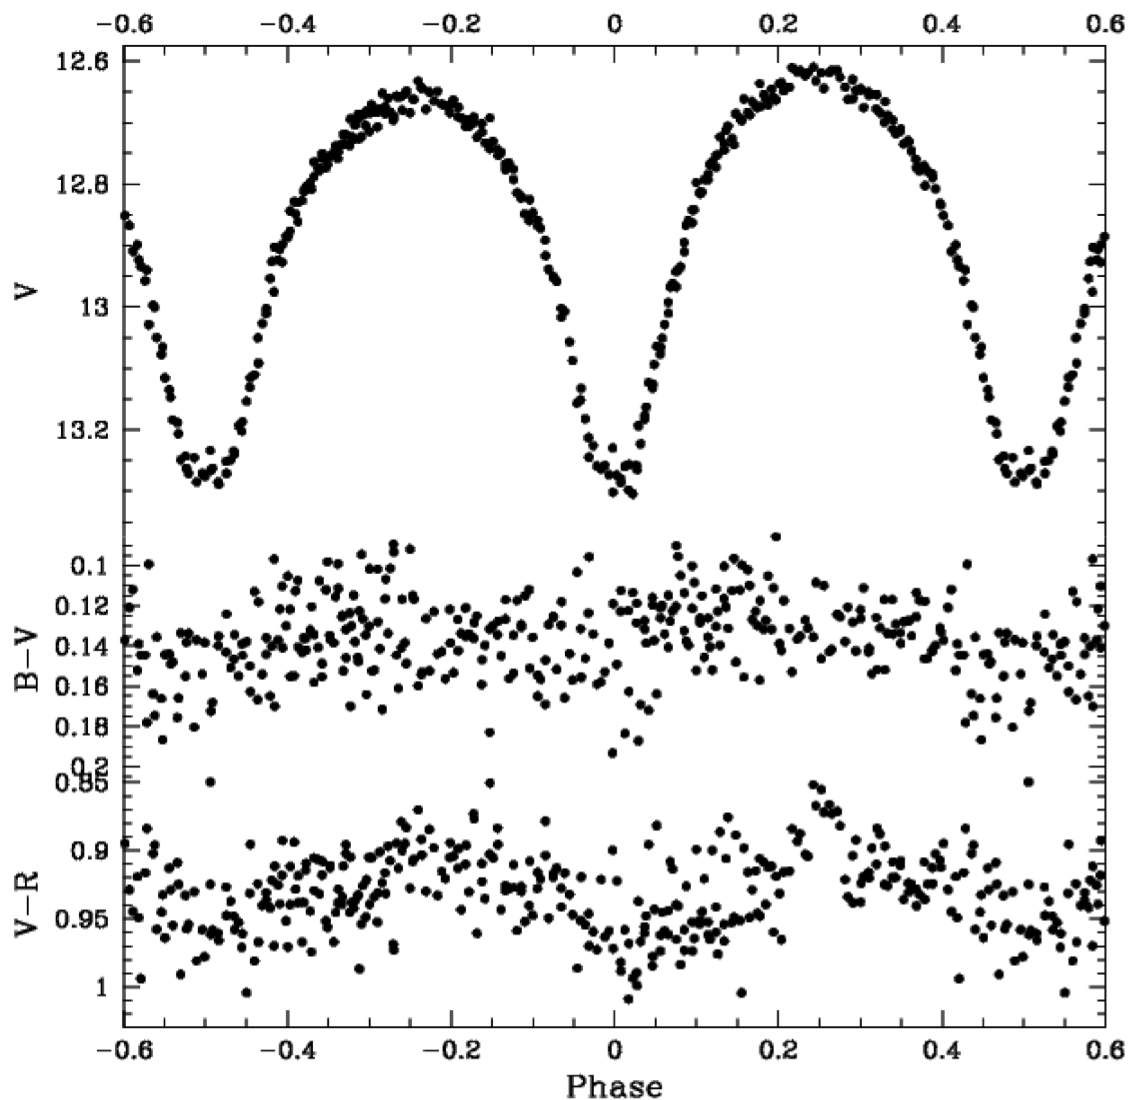 Figure 2: Folded color light curve for NSVS 4161544. All photometry is differential ensemble photometry performed by the AstroImageJ (AIJ) software package. Top panel shows folded V-band curve. Middle panel shows folded (B-V) color curve, and bottom panel shows folded (V-Rc) color curve. All magnitudes are calibrated by the known magnitudes of the ensemble stars. Error bars are not shown for clarity. Figure 2: Folded color light curve for NSVS 4161544. All photometry is differential ensemble photometry performed by the AstroImageJ (AIJ) software package. Top panel shows folded V-band curve. Middle panel shows folded (B-V) color curve, and bottom panel shows folded (V-Rc) color curve. All magnitudes are calibrated by the known magnitudes of the ensemble stars. Error bars are not shown for clarity. |
Best fitting Wilson-Devinney (WD) Models |
| All modeling is performed using the PHysics Of Eclipsing BinariEs (PHOEBE) (v0.31a) software package. PHOEBE is a graphical user interface (gui) to the WD code that is used to model binary stars. Figure 3 shows the best fit WD model with two star spots included. Figure 4 shows a graphical representation of the stellar surface. |
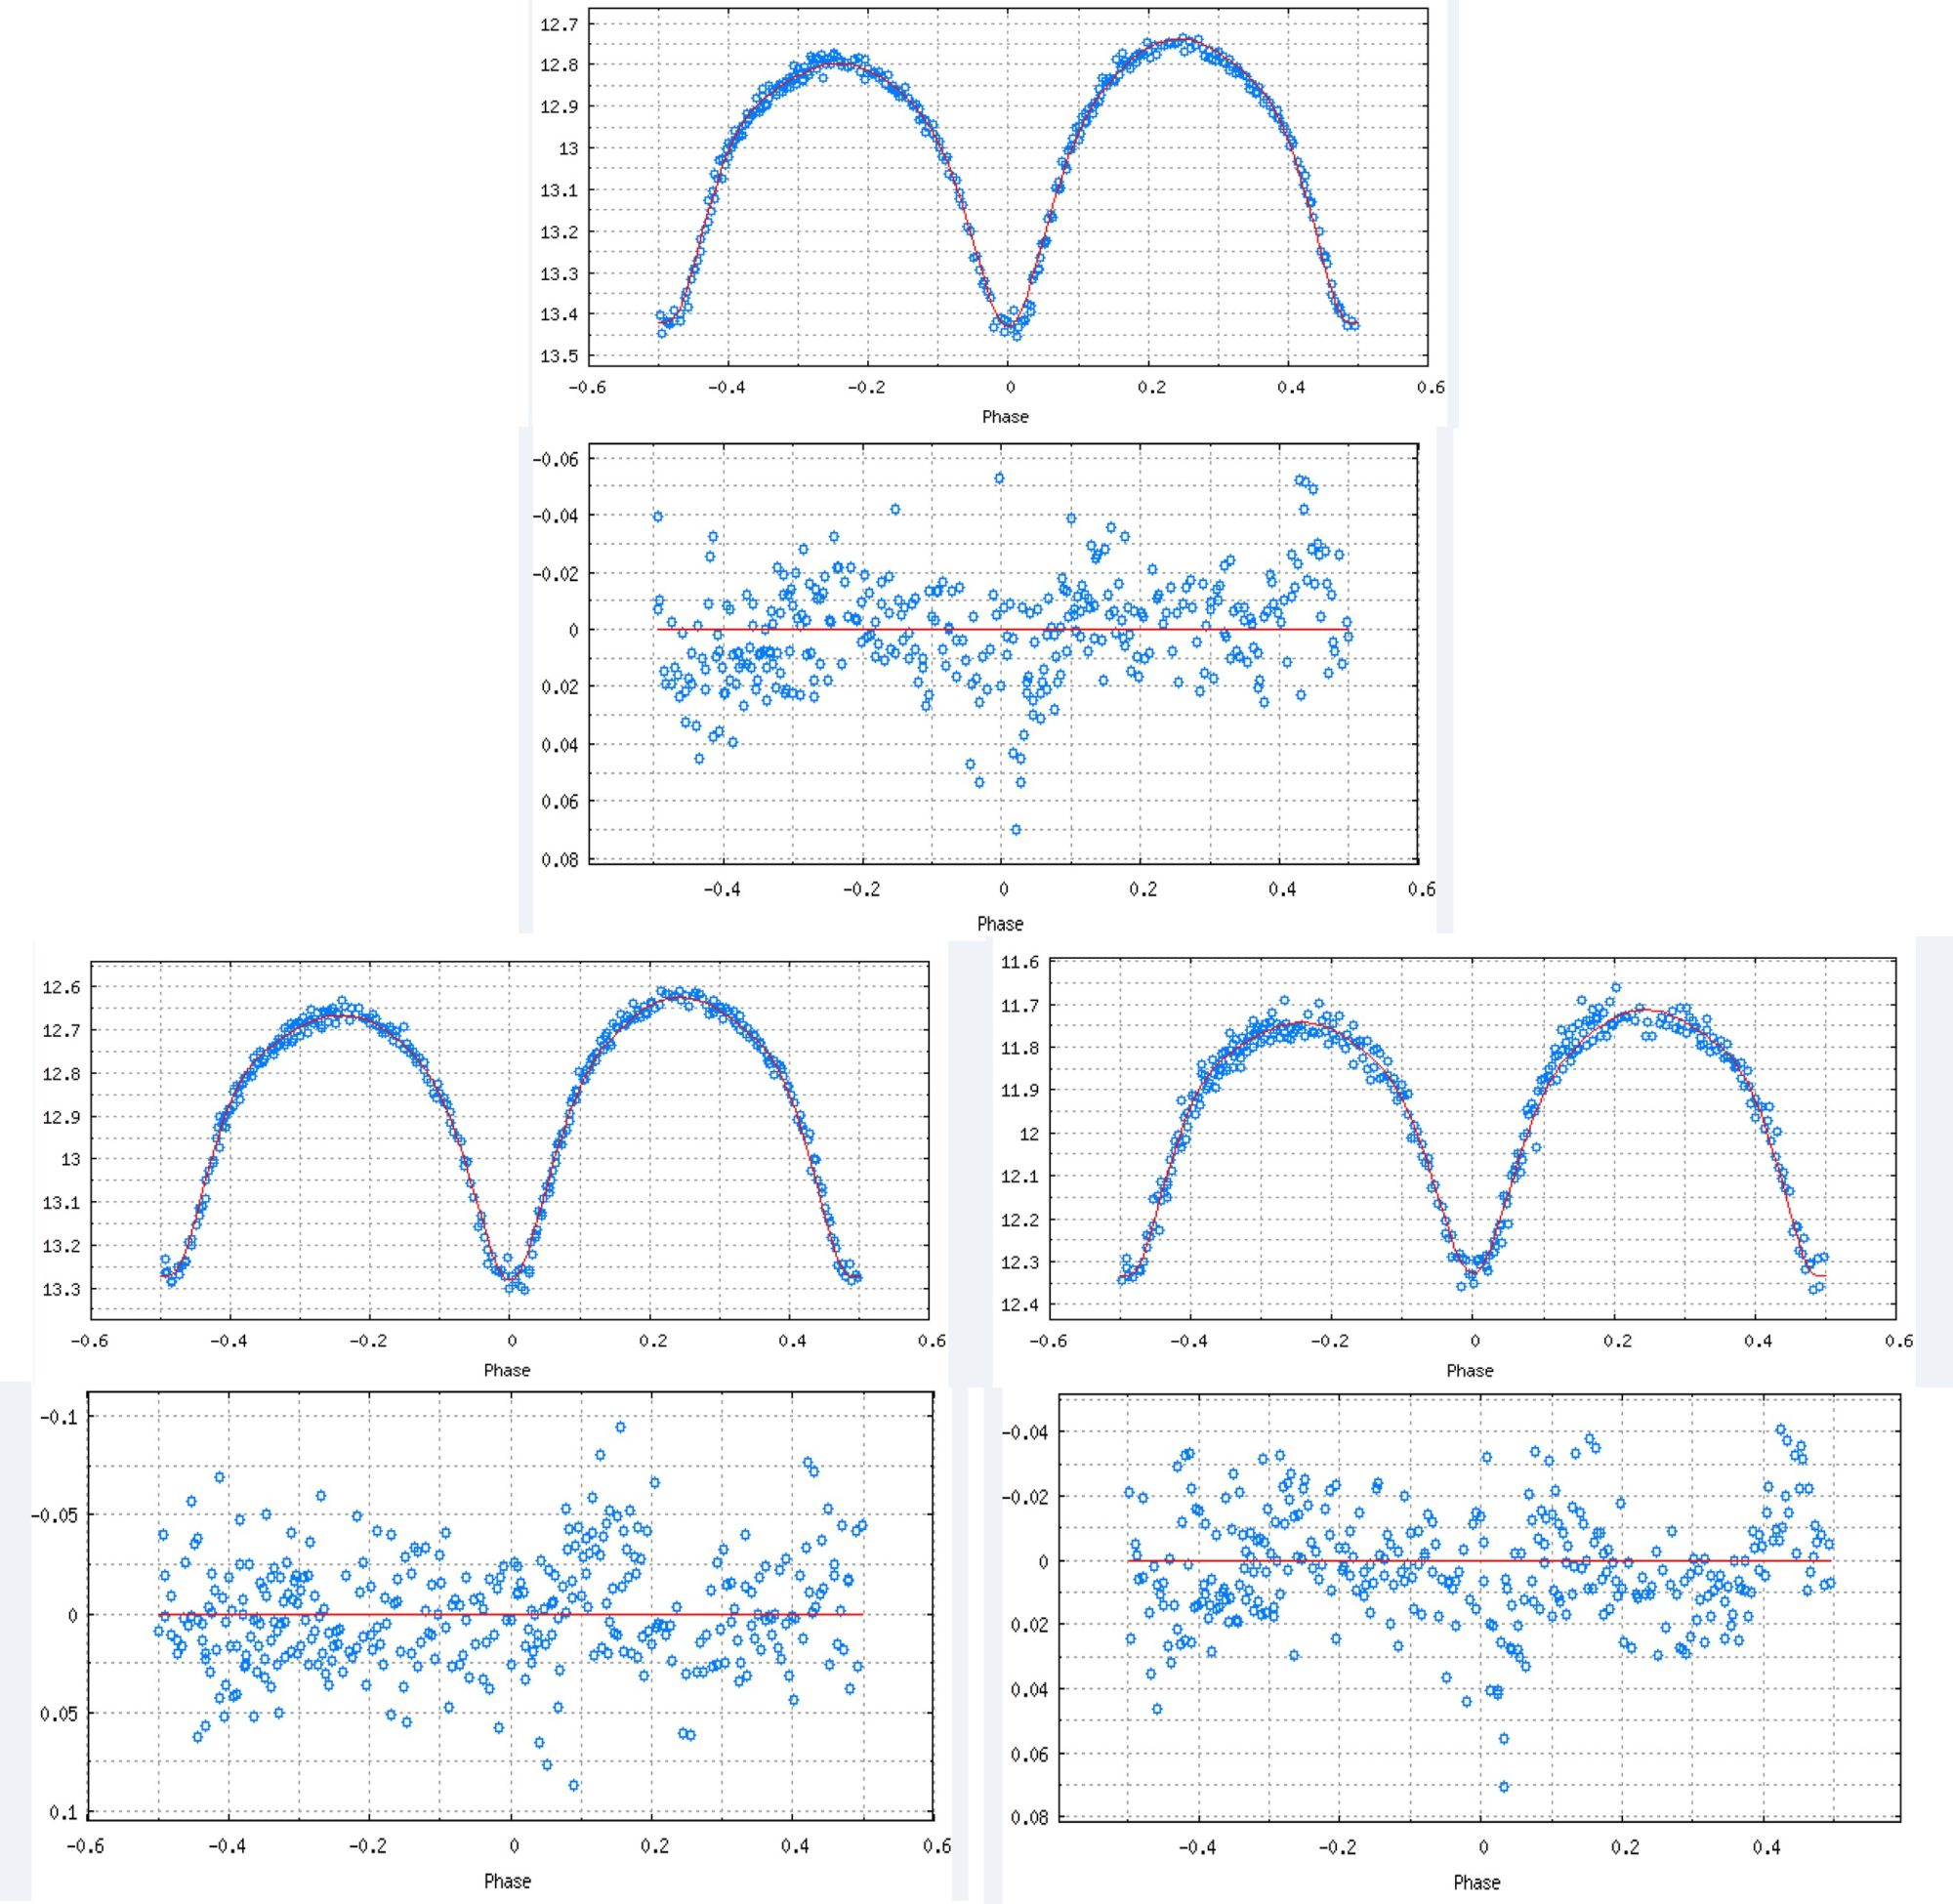 Figure 3: Best-fit models with one stellar spot for B, V, and Rc. Light curves include one stellar spot as shown in Figure 4. In all panels the top subpanel shows the folded light curve and the bottom subpanel shows the residuals of the observed data points from the best-fit model. Top panel shows the B-band photmetric data, the lower left panel shows the V-band photometric data, and the lower right panel shows the Rc-band photometric data. Figure 3: Best-fit models with one stellar spot for B, V, and Rc. Light curves include one stellar spot as shown in Figure 4. In all panels the top subpanel shows the folded light curve and the bottom subpanel shows the residuals of the observed data points from the best-fit model. Top panel shows the B-band photmetric data, the lower left panel shows the V-band photometric data, and the lower right panel shows the Rc-band photometric data. |
 Figure 4: Stellar models showing best-fit stellar models for the light curves shown in Figure 3. Orbital phases (Φ) for each panel are included with each panel. The model includes two stellar spot with one spot on each stellar component and are apparent at orbital phases 0.25 and 0.5. Figure 4: Stellar models showing best-fit stellar models for the light curves shown in Figure 3. Orbital phases (Φ) for each panel are included with each panel. The model includes two stellar spot with one spot on each stellar component and are apparent at orbital phases 0.25 and 0.5. |
Presentations |
Any poster presentations given at scientific conferences or departmental functions are given below.
|
Contact Information |
| All members of the Variable Star Research group are enthusiastic researchers with a passion for the work performed by the group. We are always happy to discuss any research projects and are always looking for like-minded and enthusiastic collaborators. For more information regarding any of the aforementioned research activities or the research activities of the Variable Star Research Group, please do not hesitate to contact Robert Berrington. |